This is Part 3 of my Data engineering in the European cloud series. In Part 1 I described my plan for creating a data lakehouse in the European cloud. In Part 2 I got a data lakehouse working at the French cloud provider Scaleway. It was a good start, but you know how it gets when you finally reach a goal: you want more. I wanted PySpark, notebooks, some data to query and visualisations.
PySpark and Jupyter Hub
Let’s start with PySpark and notebooks. Because we can tackle that one in one step.
Claude Code suggested to run Jupyter Hub. With this you can run notebooks on the server. And run PySpark on them by connecting to Nessie.
If you’re familiar with Azure Fabric, you can run notebooks on the server there as well, with PySpark. You can even automate data pipelines with that. I would love to have something similar here.
Claude Code had been working for a while to create this, because apparently it was not a straightforward task. So great that I didn’t need to figure this out myself. You can find the end result of this AI odyssey here: jupyter-pyspark-values.yaml. You need to fill in passwords, access and secret keys.
Add JupyterHub to the Helm repo:
helm repo add jupyterhub https://hub.jupyter.org/helm-chart/
helm repo update
And install the Helm chart (don’t forget to set KUBECONFIG first):
helm install jupyter jupyterhub/jupyterhub \
  -f jupyter-pyspark-values.yaml \
  -n lakehouse
After it got some time to install, you need to do a port forward from JupyterHub to your local machine:
kubectl port-forward -n lakehouse svc/proxy-public 8000:80Note that this is a different port forward from Trino. If you want two port forwards in one go, this is how to do that on a Mac / Linux machine. (I could not get the same result in Windows Powershell, so I just ran 2 Powershell windows with one port forward each.)
kubectl port-forward -n lakehouse svc/trino 8080:8080 & \
kubectl port-forward -n lakehouse svc/proxy-public 8000:80
Now you can connect to http://localhost:8000 in your browser. The first thing JupyterHub will ask is to launch a server. And after that you should be set to go.

In earlier iterations JupyterHub wasn’t very stable. I got one Server error after another. Later Claude Code found out that network sessions were interfering with each other. In the later version of jupyter-pyspark-values.yaml that got fixed a whole lot. But still it is not 100% stable yet. There are some weird reasons why I lose my connection. For example: I tried to visualize my Iceberg data in the Python package matplotlib. Every time I tried that, I lost my connection. I tried to run matplotlib with some demo data. That ran without issues.
Truth be told: my Kubernetes cluster doesn’t have a lot of memory. It is the smallest, cheapest I could get. So that might also play a role.
Alternatives are to run your notebooks locally, but that is not the Fabric-like setup I had in mind. Talking about “what I had in mind”: I have to say the user interface in Jupyter Hub looks like it is 10 years old. A far cry from notebooks in Azure Fabric and Databricks. I will be looking for alternatives in the future.
European open data
An empty data lakehouse will teach us only so much. I’d like some data. At first I was playing with the open data from the Dutch parlement (Tweede Kamer). But for a European topic I thought European open data would be more appropriate. Which made me wonder: does the European Parlement have open data? It turns out that they do. They have data on members, meetings, documents and votes.
Hmm, maybe I can find out here who voted for that mass surveillance fiasco called ChatControl 2.0. But I digress.
I decided to keep it simple: I want current MEPs (members of parliament), meetings and who attended a meeting. That way I can make a simple aggregation what political party turned up at what meeting.
First I tried the /meps API, which turned out to have all the members of parliament who ever existed. Bit too much. Luckily there also is an API for current MEPs: /meps/show-current. I also got the data (for 2025) of the Meetings API: /meetings. Should you store this data in tables, you can join it on the current MEPs table.
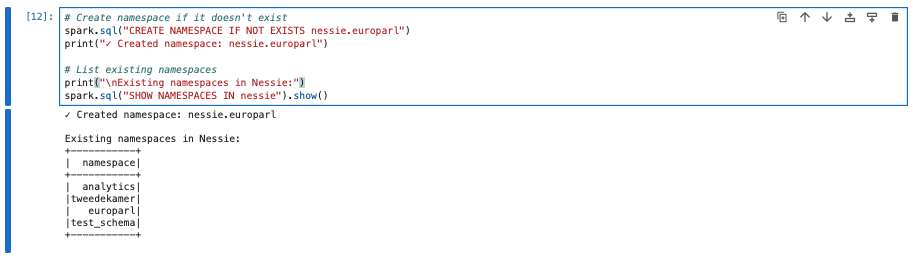
I could describe how I created this in every detail, but you can see for yourself: the notebook is available on Github as europarlement.ipynb.
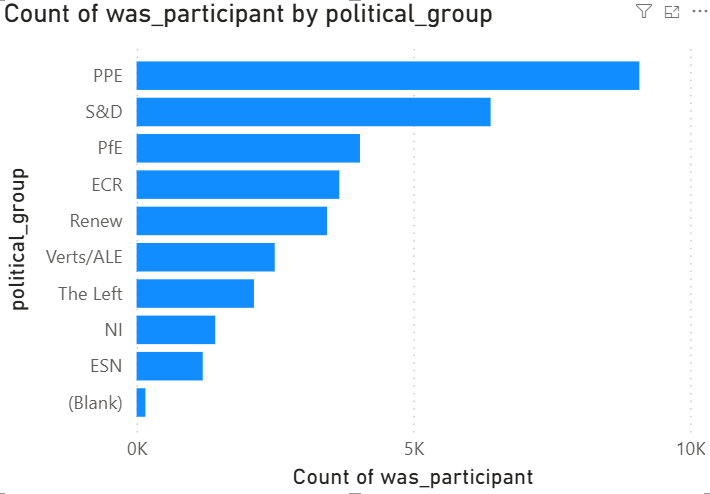
After creating these tables and inserting the data, you can query the attendance of meetings per political party. Here is a query for that:
select cm.political_group , count(cm.id) as attendance
from iceberg.europarl.meetings m
inner join iceberg.europarl.meeting_persons mp
on mp.activity_id = m.activity_id
inner join iceberg.europarl.current_meps cm
on cm.id = mp.personid
group by cm.political_group
order by cm.political_group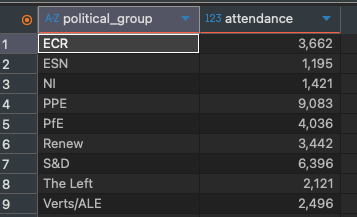
It is a work in progress: I didn’t correct for number of seats etc.. But good for a first try.
Data visualisation
Now I would like some data visualisation. Claude Code suggested the open source Superset, an open source data visualisation suite. But Claude never got the setup working. For one reason the architecture of Superset is more complex. On the other hand our simple Kubernetes cluster possibly was running into its limits. I might want to try this out on a larger sized cluster in the future.
Let’s try everyone’s favourite data visualisation product: Power BI. I have Power BI Desktop running on my work laptop (no cloud involved). A connection to my data lakehouse (that is Trino) should be one of the minimal goals here.
Surprisingly this was not so easy. Trino has JDBC, but apparently Power BI doesn’t like that. Okay, maybe ODBC then? There are multiple Trino ODBC driver vendors (yes, vendors). Surely we should look no further than Starburst’s (Trino’s home company) own ODBC driver?
I installed the Starburst ODBC driver, configured a data source (made sure that I had the port forward running):
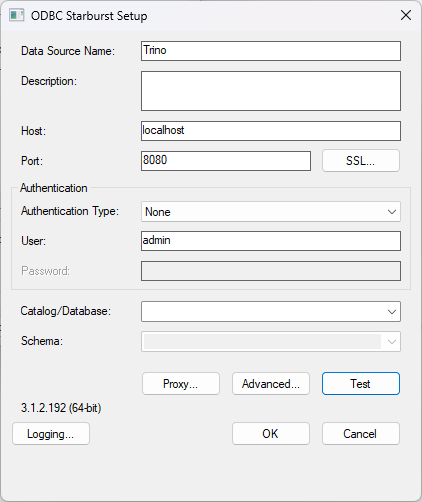
And… nope! I’ve tried all kinds of settings. To no avail.
After enough failures I was ready to try one of the other Trino ODBC drivers. So I tried Simba. You can get a 20 day trial. But what is the ticket price? $2625 per single seat.

Okay 20 day trial. Let’s try it anyway.
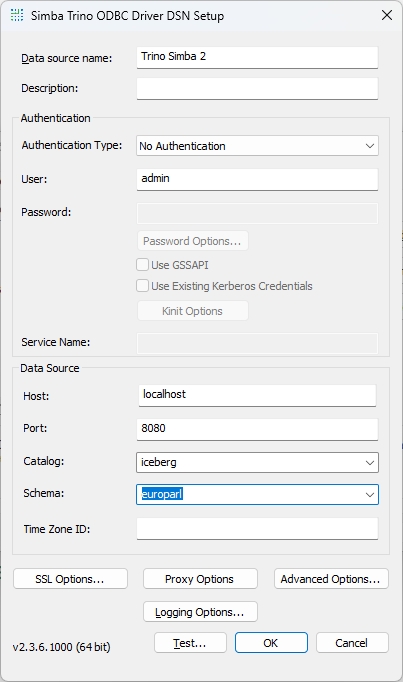
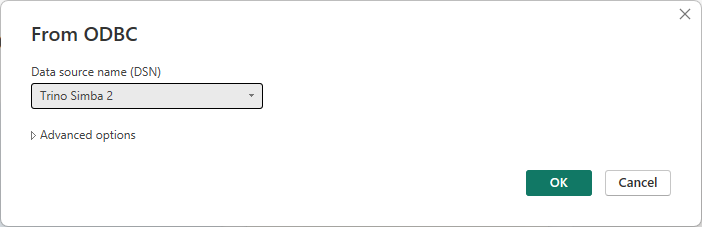
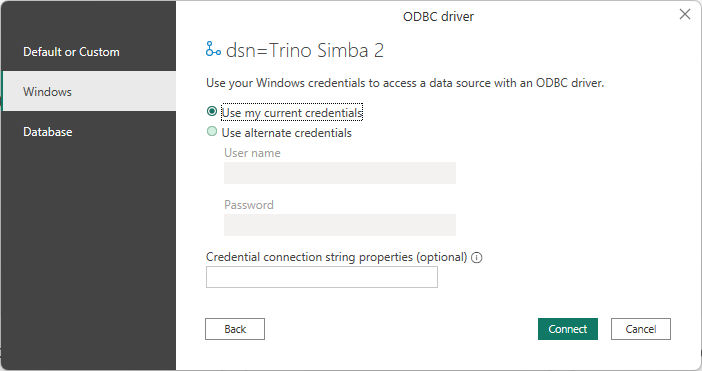
When you use this data source for the first time in Power BI, choose Windows credentials.
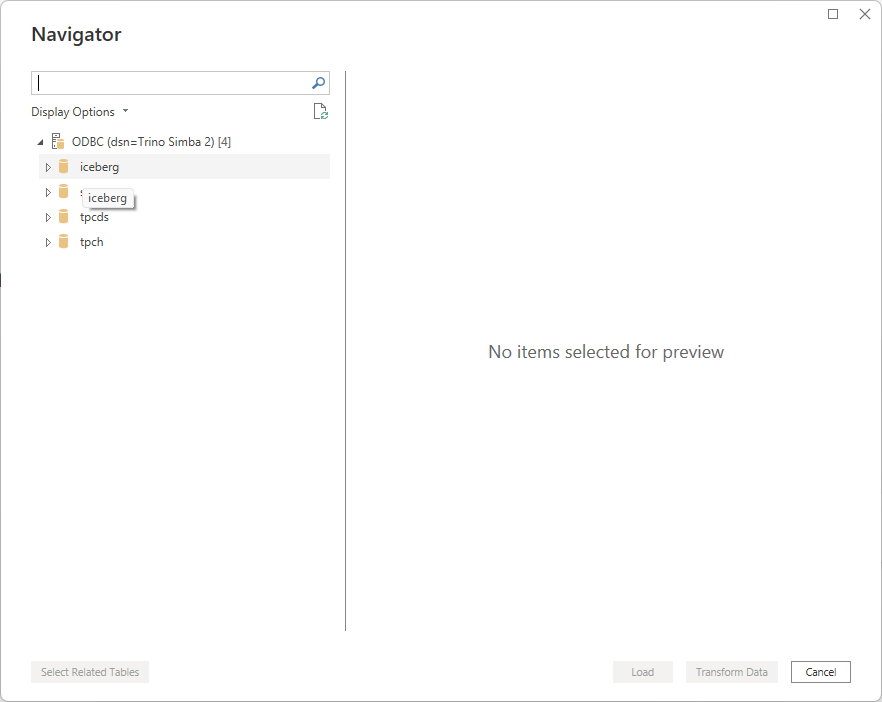
And sure enough: we’re seeing the iceberg catalog:
A bit of fiddling with Power BI and there: we’ve got a data visualisation:
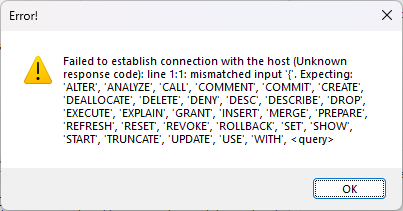
Claude Code told me another way was by connecting to Trino’s REST API. You can do that from Power BI by going to Get Data, Web and then fill in this form.
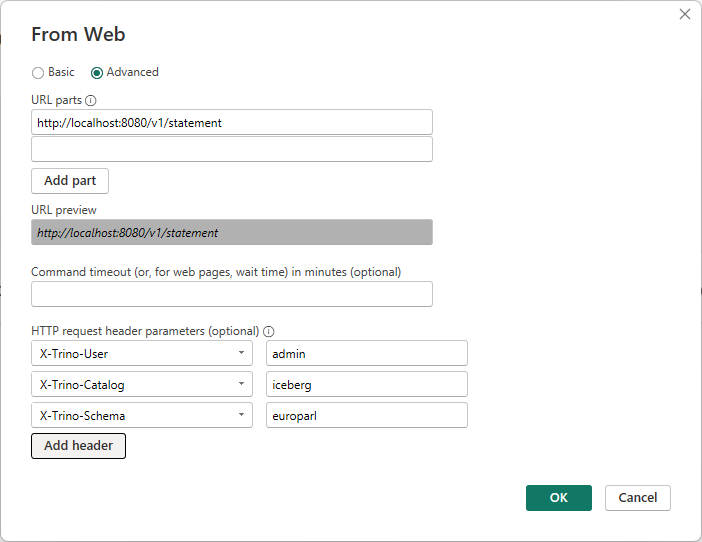
Or so I hoped. Note there’s no place to choose a method here (GET or POST). And sure enough Trino responds with:
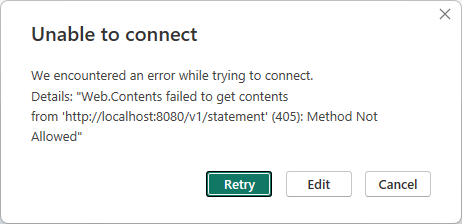
I have tried all kinds of other suggestions from Claude Code to get the REST API working. Unfortunately I got nowhere. Claude eventually suggested to setup a local DuckDB or some FastAPI Python code and then query it from there. I haven’t tried that. But surely it should be simpler (and cheaper) to get a connection going from Power BI to Trino?
End of the Kubernetes cluster at Scaleway
This has been a quite successful experiment. It’s time to stop the Kubernetes cluster and delete the object storage. Before we do that, let’s take a quick look at the current consumption:
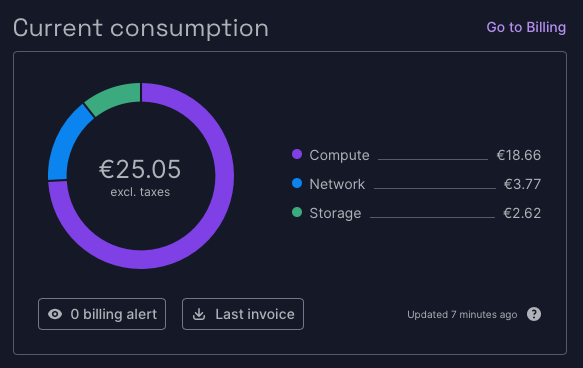
You can see on the Billing page most of the cost went to the Kubernetes cluster and I paid nothing for the object storage. But for the Kubernetes setup some block storage was needed and that resulted in some costs for storage

In hindsight there was one way I might have reduced the costs for the Kubernetes cluster: you pay for the pool, not for the cluster. Maybe I could have deleted the pool every time I was done using it? Something to try next time.
One last thing to note: in Part 2 I said I wasn’t able to change the project name, but Scaleway has changed that now.
0 Comments