Data engineering in the European cloud – Part 2: Scaleway

This is Part 2 in a series where I try to create a data engineering environment in the European cloud. In Part 1 I described my plan for creating a data lakehouse in the European cloud. Now it’s time to get our hands dirty. We’re going to do this in the Scaleway cloud.

The architecture

To get this data lakehouse running we will create a Kubernetes cluster and object storage for our data storage. In Kubernetes we can run containerised applications that will run our data lakehouse. I’ve consulted ChatGPT for this architecture. It had a better and more modern solution than I originally had in mind.

We’re going to use the Apache Iceberg open table format. This will allow us to create database like tables based on Parquet formatted files. Nessie will be the Iceberg data catalog (Hive Metastore was another option). It allows our data solutions to find the Iceberg tables and underlying Parquet files.

Trino will be the query engine. That will be the fastest way to get our first queries going.

(more…)

Data engineering in the European cloud – Part 1: the plan

We all know how dependent we have become in Europe on US cloud providers. We know about the risks of this in the current political climate. And yet we keep using more and more US cloud services. Read Bert Hubert’s writings about the European cloud situation.

And to be honest, when customers ask for advice on starting a new data engineering ecosystem, Azure Fabric and Databricks are on the top of my list.

But while it might be hard to switch from Office 365 to open source solutions (especially moving all your users to these unknown platforms), in the data engineering landscape there are so many widely adopted open source solutions. Solutions that end users rarely need to deal with directly. Couldn’t we run these products somewhere else? So I went on an investigation.

(more…)
Detail of the Inky Impression e-ink display with a star map depicting on it.

inkystarmap – an always up to date starmap on the wall

Last year I did a talk at Pycon Ireland 2024 about e-ink displays, in which I gave several examples of ways you can program e-ink displays on a Raspberry Pi with Python. For this talk I developed one extra application: displaying a star map on an e-ink display. But the e-ink displays I had available back then were a bit small for this purpose.

Enter Pimoroni’s new Inky Impression 13.3 inch e-ink display. As soon as it arrived, I worked on the star map again. It turned out that 9 months later, some things had changed. But after 2 evenings experimenting, I got a new working version. Now utilising the gradient display of the Python package starplot. On the new 13.3 inch display with brighter colours, it worked perfectly.

(more…)

Masterclass Machine Learning in Cycling

Last Tuesday Paul van Herpt and I traveled to Lille for a special Machine Learning and Cycling Masterclass. As data partner of Soudal Quick-Step Pro Cycling Team, these are exactly the applications that touch where we as Transfer Solutions can make the difference. Hence Paul and I followed this special course from the IDLab (UGent – UAntwerpen – imec).

The author (left) and Paul van Herpt at the Masterclass Machine Learning in Lille.

Machine learning is already used a lot in sports. In soccer, for example, a huge amount of statistics is at hand: who has how long ball contact, who usually shoots to whom, makes the most runs, who is the most dangerous? That kind of data is already very easily traceable. And in tennis, it is easy to track the ball, calculate speed, etc..

(more…)

How to use data to find the best spot for a sponsor event

As you might know I’m currently doing sponsor events for Tour for Life, to collect funds for the Daniel den Hoed Foundation, for cancer research.

Aniel, me and Transfer Solutions CTO Albert Leenders at a sponsor event last Saturday in Ede.

Aniel and me have been doing this for the 3rd year now. And we noticed quite big differences in proceeds per location. You’d think large crowds (like on Dam Square in Amsterdam) would guarantee large amounts of donations. Not so. A more humble place like my home town Gouda outdid them by a factor of 9 in the same year!

(more…)

Visiting PyGrunn 2025

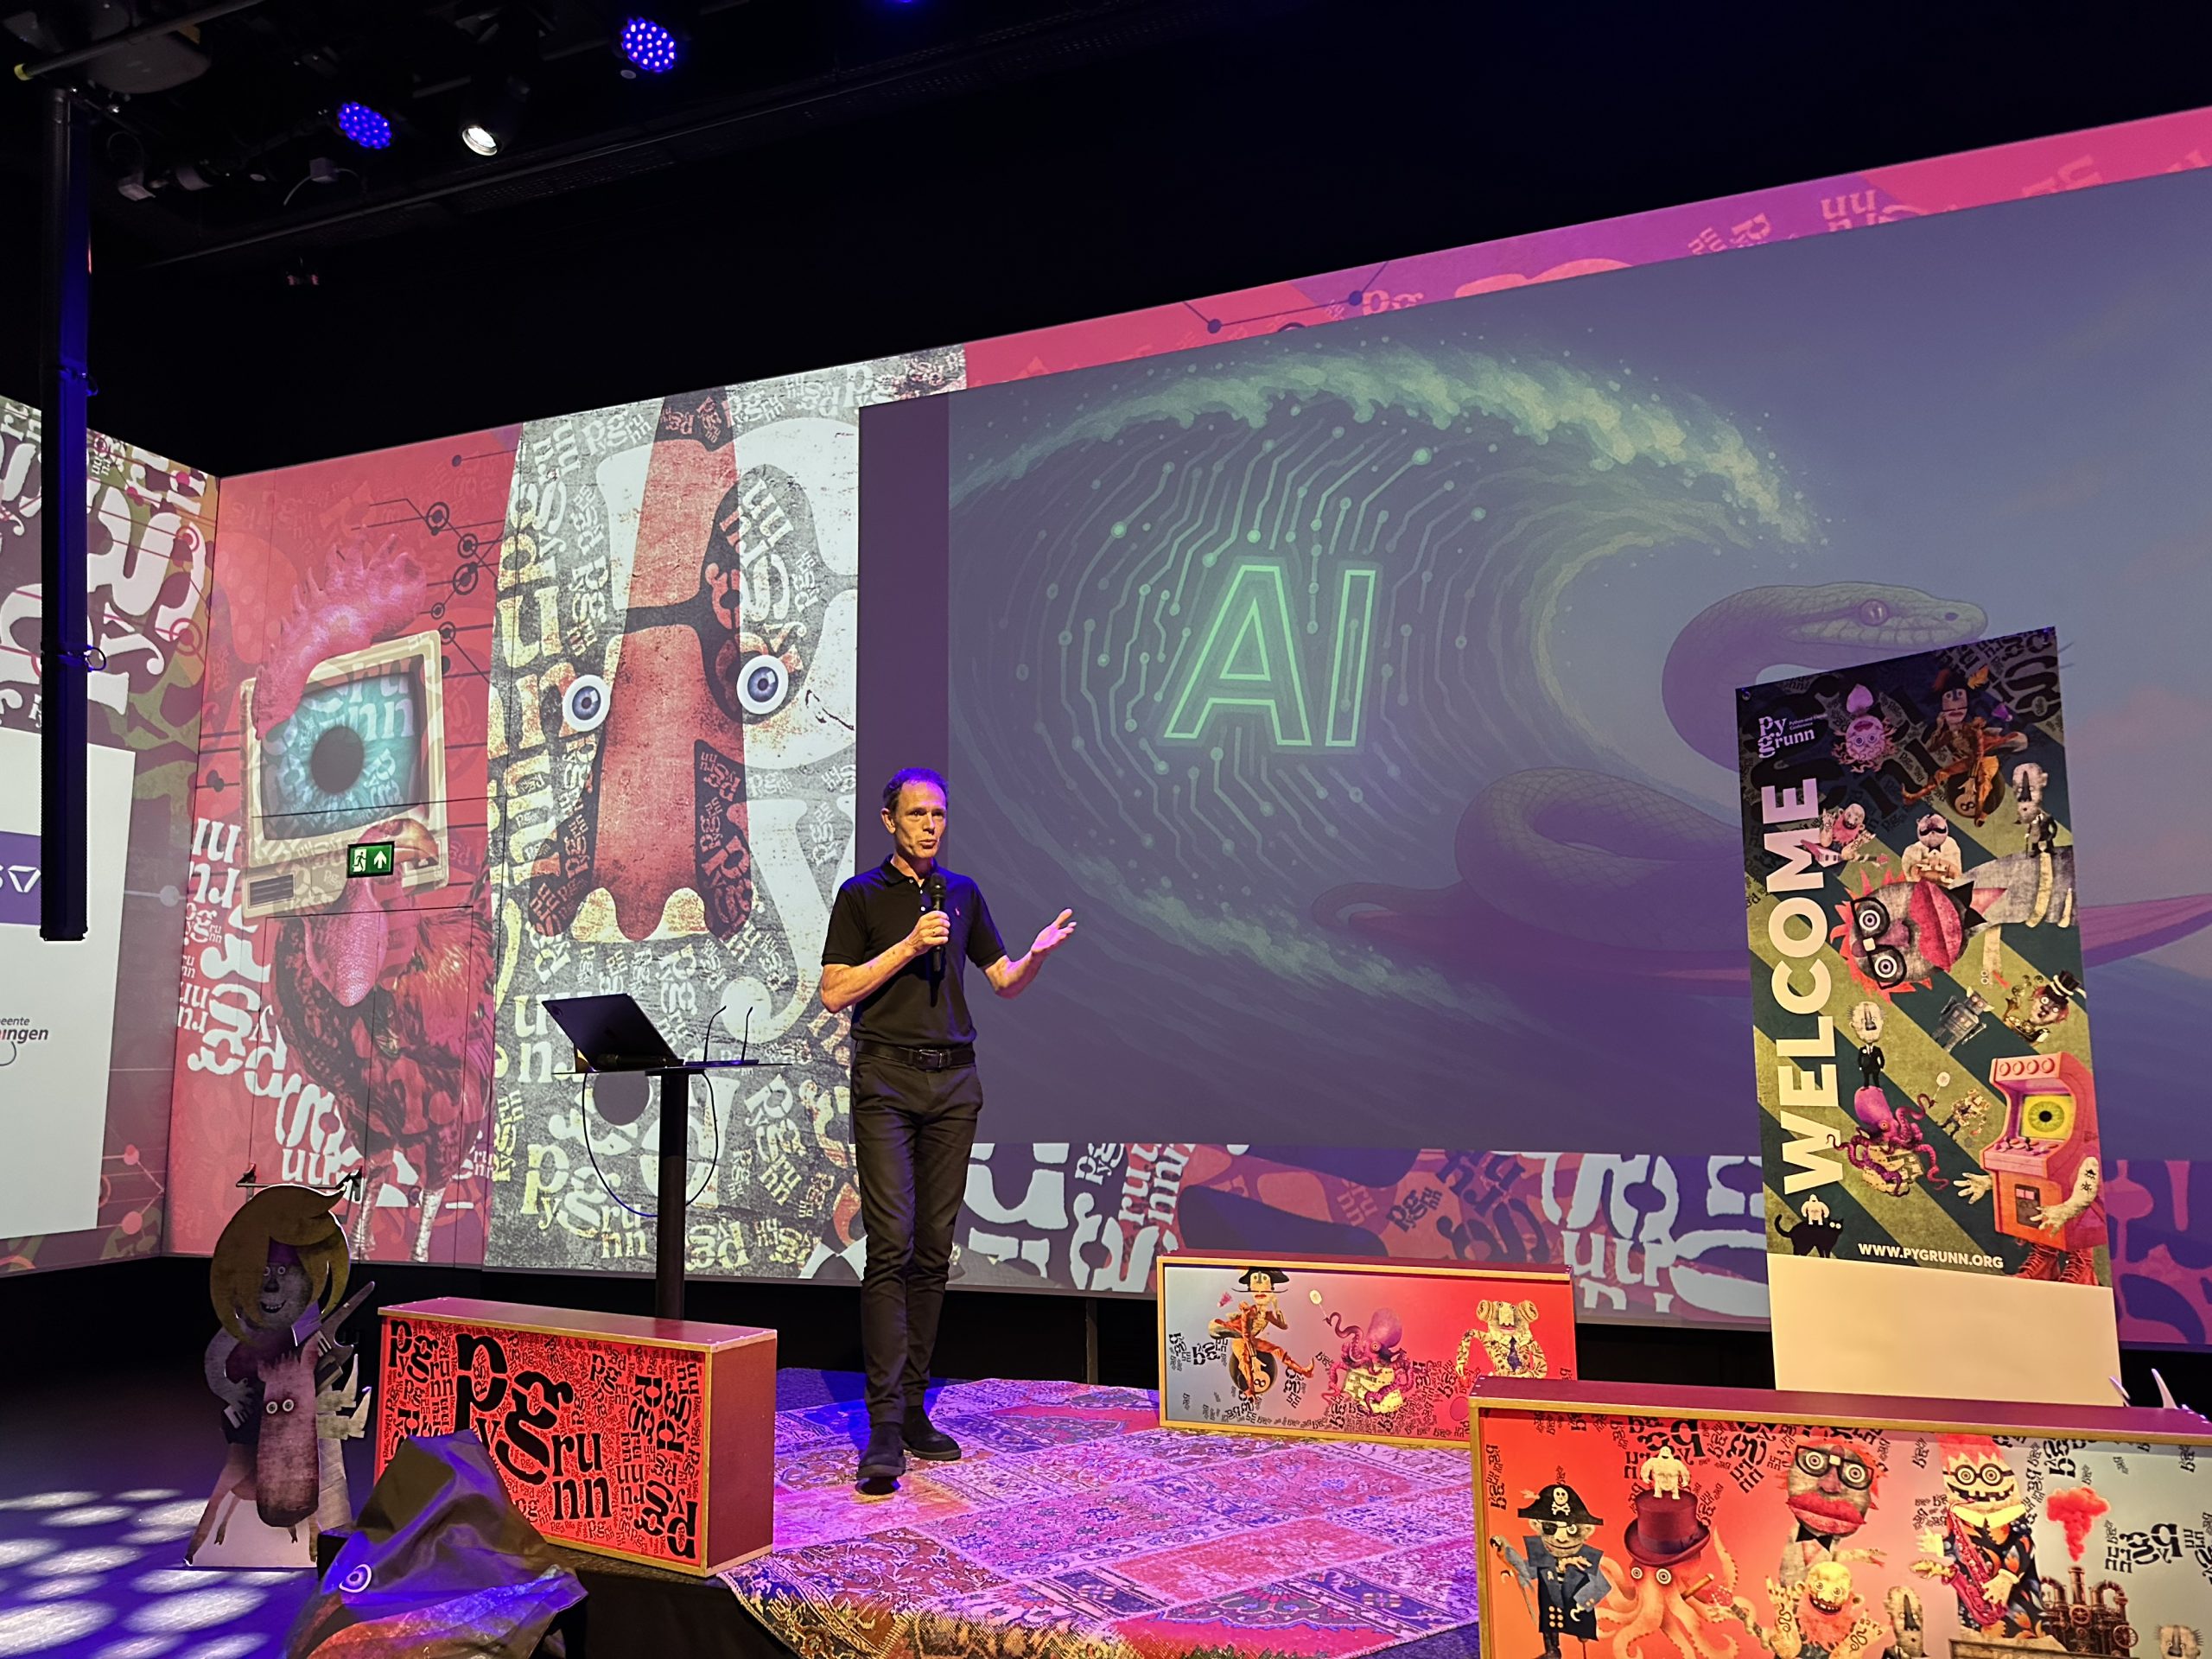
Conferences are a great way to learn diverse topics in your field. That’s why I like to go to events like Pycons and last Friday, PyGrunn. PyGrunn is a Python event in Groningen, the Netherlands. I submitted two talks for the event myself. One of them was selected.

Here is a recap of the talks I attended and the stuff I learned, so you maybe get inspired to attend Python conferences and even speak at these events.

Keeping your Python in check – Mark Boer

Python was originally developed to make coding more accessible. Where at other programming languages you had to tell what type of data type your variables are, Python deduced this automatically. Good for beginning coders, maybe not so good for advanced data solutions.

Mark Boer has experience in strong typing in his data science solutions. He shared how you can ensure typing in different ways: in data classes, using Pydantic and named tuples. The talk assumed that the attendees already had experience with typing. I had not, so it was a lot to take in. But if I can review the video in a few weeks, I hope to catch on.

(more…)

My experiences with agentic AI

Originally I wanted to write a blogpost about what data engineers are going to do with AI writing their code. But before I can write that, I need to share my experiences so far. Because from this you’ll get an idea where they work and where they lack.

This is not meant as a treatise of AI coding assistants and agentic AI tools. But here are some of the tools I’ve tried:

  • I’ve worked with VSCode and Copilot now for at least a year.
  • I regularly use ChatGPT and Phind.com for advice on programming tasks.
  • I’ve used VSCode with Cline / Roo Code extensions and LLM models.
  • And I’ve used Claude Code (which is not free, but there seems to be a trial amount of free tokens). Claude Code works from the command line.

The agentic AI solutions are interesting. They are quite capable to create whole Python projects based on your requests. But it doesn’t mean these projects will work right out of the box. Usually there needs to be some tweaking and restarting and checking results.

(more…)
Diagram of heights of Olympic athletes. There's a big gap between short and tall athletes.

Profiling data with ydata in PySpark

When you got a dataset to explore, there are several ways to do that in PySpark. You can do a describe or a summary. But if you want something a little more advanced, and if you want to get a bit of a view of what is in there, you might want to go data profiling.

Older documentation might point you to Pandas profiling, but this functionality is now part of the Python package ydata-profiling (which is imported as ydata_profiling).

I’ve been following this blog on starting with ydata-profiling:

https://www.databricks.com/blog/2023/04/03/pandas-profiling-now-supports-apache-spark.html

Getting ydata-profiling to work is not exactly a walk in the park. You’d think you can just feed it your messy dataset and it will show you what the data is like. But I encountered some problems:

  • I got errors about missing Python packages in some situations.
  • ydata doesn’t seem to like dataframes with only string columns.
(more…)