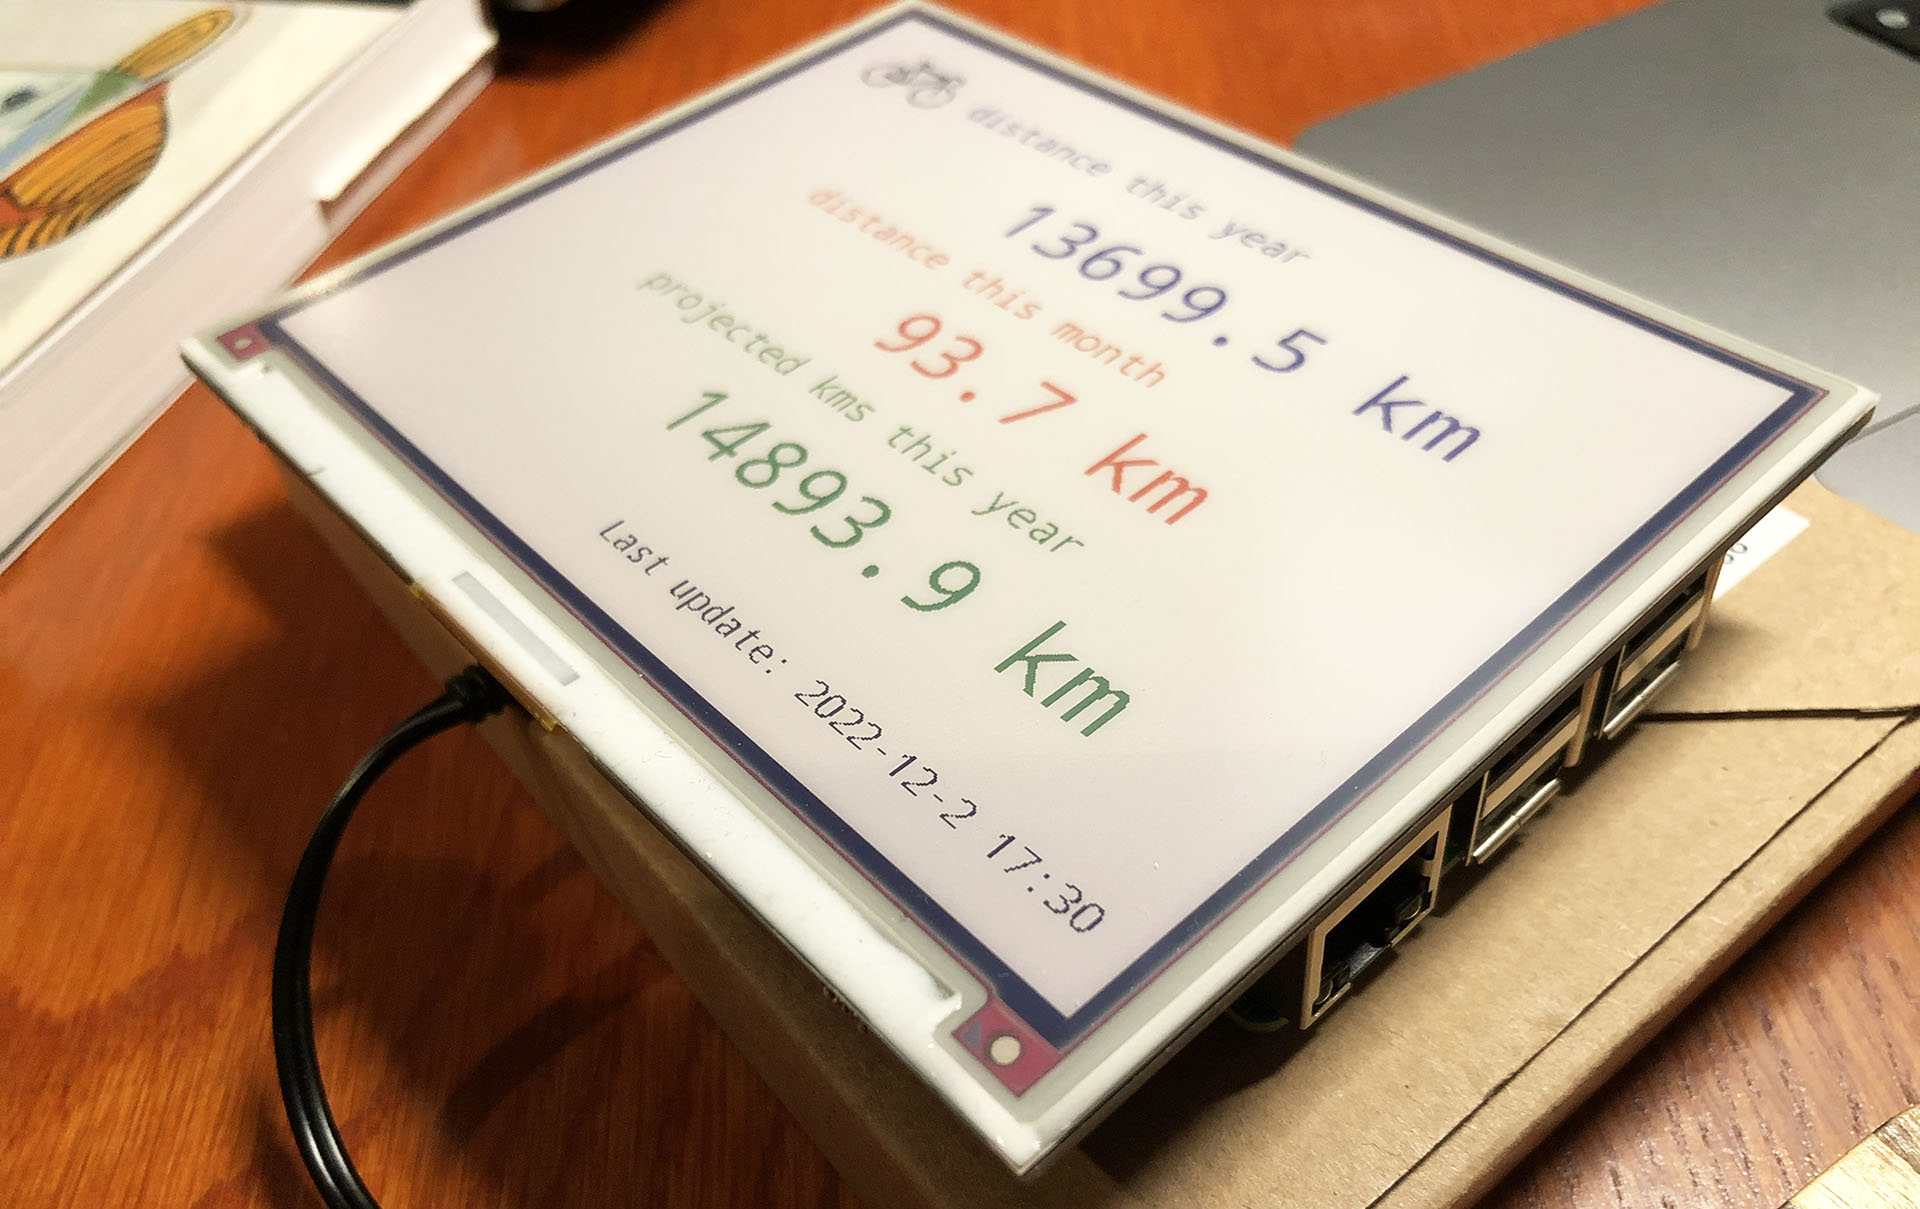
A Strava dashboard on a Raspberry Pi (Part 1): Setting up the Raspberry Pi

This is the list of hardware I’ve used:

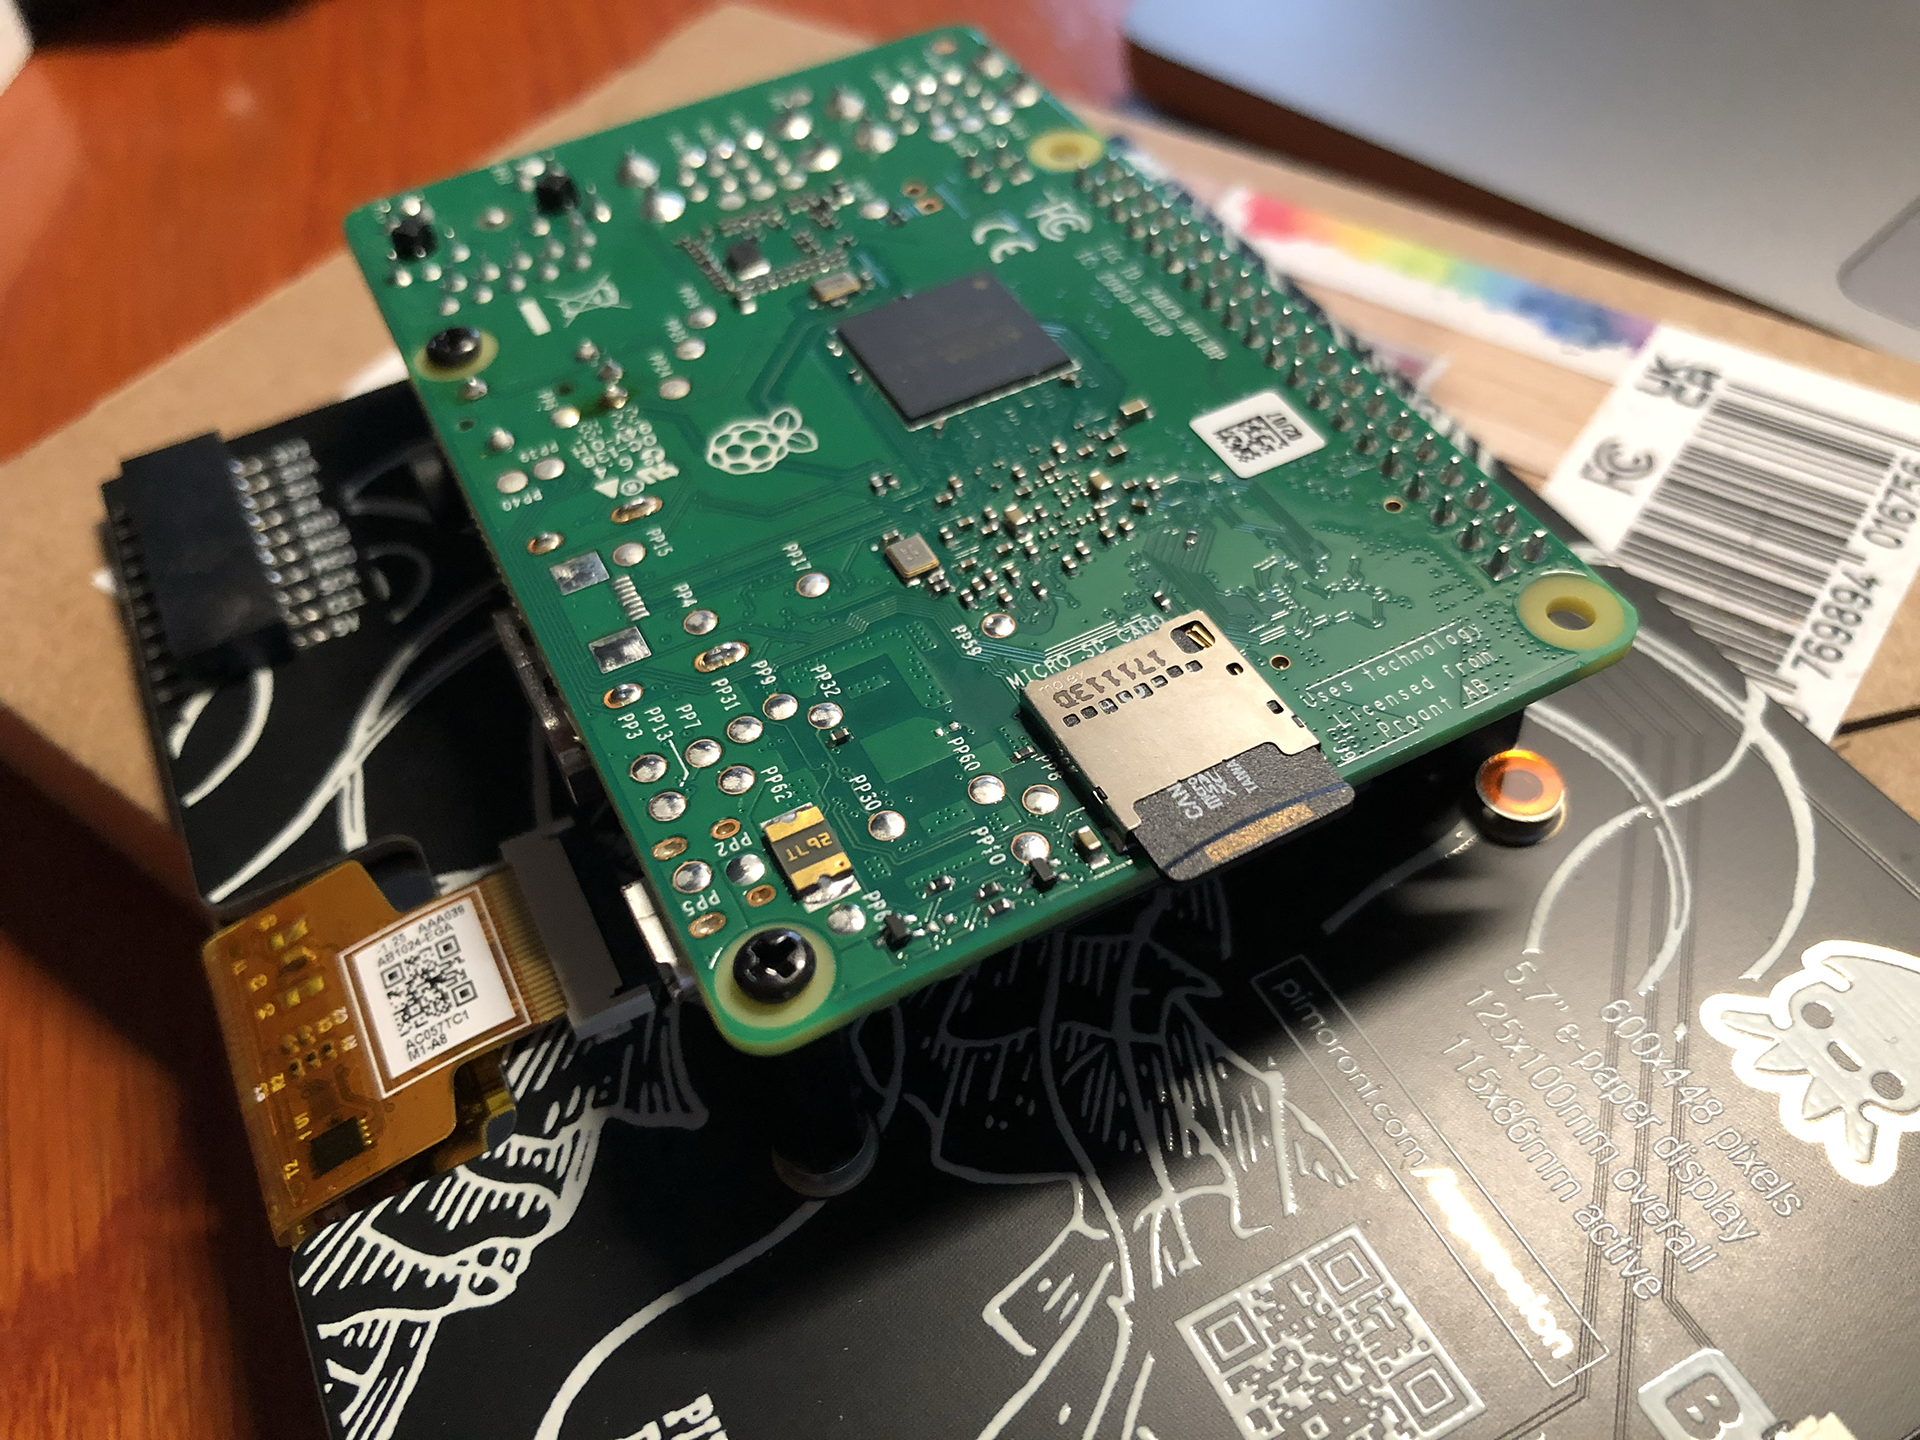
  • An Inky Impression 5.7 inch e-ink display.
  • (The Inky Impression comes with a 40-pin female header included to boost height for full-size Pis and standoffs included to securely attach to your Pi)
  • A Raspberry Pi 3 model B+ (I had lying around) + power supply
  • A micro SD card with 8 GB storage or more.
  • Initially: keyboard, mouse and monitor (but if you configure the WiFi on the Raspberry Pi and configure it to allow remote SSH, you can connect to it via WiFi from the convenience of your regular computer)

For those who don’t know a Raspberry Pi: this is a very small and quite cheap computer. The Raspberry Pi 3B+ I’ve used for example is about 40 euros. But you can spend even less, because my Strava dashboard doesn’t exactly require a lot of computing power.

So you could instead use a Raspberry Pi Zero 2 W (15-25 euros), which takes up less space also. But I believe this will require soldering to attach the GPIO. And it seems to be out of stock on a lot of sites.

(more…)

Building a Strava dashboard on a Raspberry Pi with an e-ink display

Let’s face it: my purchase of the Pimoroni Inky Impression 5.7 inch display was a solution looking for a problem. I saw a video about it and I was sold on the idea of having an e-ink display on one of my Raspberry Pi’s.

The Pimoroni Inky Impression on a Raspberry Pi 3B

While having a 7-colour e-ink display is cool and all, I had to come up with a good plan to utilize one. So it wouldn’t end up in a drawer after a short experiment.

You can use it to display images, but it is 7-colour. So you have to “dither” full colour images to have it display well. Actually comic book style images are displayed much better than the average dithered photo. The resolution is quite low (600×448) and the refresh rate is quite slow (10-20 seconds). But for some applications this is just fine.

(more…)

Using Stable Diffusion to create images for a presentation

Have you heard about text-to-image models like DALL-E 2, Stable Diffusion and MidJourney? These are AI algorithms that take in text (the “prompt”) that describes what kind of picture you want as input and as output the algorithm creates that picture, based on billions of images.

An example could be “an astronaut on a bicycle on the moon by Van Gogh”. And this would be one of the results:

{“prompt”: {“software”: “imaginairy”, “prompts”: [[1, “an astronaut on a bicycle on the moon in the style of Van Gogh”]], “prompt_strength”: 7.5, “init_image”: “None”, “init_image_strength”: 0.6, “seed”: 938321671, “steps”: 40, “height”: 512, “width”: 512, “upscale”: false, “fix_faces”: false, “sampler_type”: “plms”}}

I got access to DALL-E 2 in July this year. DALL-E 2 is a closed source algorithm made by OpenAI. You can sign up to request access to DALL-E 2. Once you get access you can use it for free for a limited of runs. After that you have to pay to use it more.

(more…)

I started vlogging about data mesh (and other things)

Last June I made a short video while walking in the park next to the DIKW Intelligence office. And I posted it on LinkedIn. To my surprise it did very well. So I thought: why not make more of these short videos on data topics? And why not make them in somewhere in nature?

I’m on my bike almost every day this time of year. Surely I could make a short stop and do a little talk? I started to make them in Dutch and then also in English. (more…)

Adding the track of my bike ride on a Folium map

Having markers of videos and photos taken during my bike ride is cool and all, but how about having a track of the bike ride itself? All my bike rides are registered on Strava, the cycling and running app. Strava has an API for developers, but it requires connecting via OAuth 2.0 and knowledge of the API. I decided to go an easier route: because I’m Strava Premium member, I can download the GPX track of any ride, including my own.

These .gpx track files are of the same XML structure as we saw embedded in video files in my last blogpost. I can just open the file and use almost the same Python code to read the locations.

(more…)

Photo locations, marker icons and displaying photos on my map

When I was finished last week with creating my video location map in Python, I thought “shame I can’t plot photo locations”. That’s because my Fuji X-T30 camera doesn’t store GPS info. When I bought the camera I assumed every modern camera had GPS tagging, so I didn’t even checked that feature. Too bad. But I also made some photo’s during my vacations with my humble iPhone 8. And it does have GPS tags. So let’s plot some photo locations.

(more…)